 .
.Wow! Really counter-intuitive!

Vlad V's List: Probability, Randomness and Statistics (PRS)
-
Concepts
-
-
Bayesian probability is one of the most popular interpretations of the concept of probability. The Bayesian interpretation of probability can be seen as an extension of logic that enables reasoning with uncertain statements. To evaluate the probability of a hypothesis, the Bayesian probabilist specifies some prior probability, which is then updated in the light of new relevant data. The Bayesian interpretation provides a standard set of procedures and formula to perform this calculation.
Bayesian probability interprets the concept of probability as "a measure of a state of knowledge",[1] in contrast to interpreting it as a frequency or a physical property of a system.
-
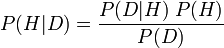
Given some data and some hypothesis, the posterior probability that the hypothesis is true is proportional to the product of the likelihood multiplied by the prior probability. For simplicity, the "prior probability" is often abbreviated as the "prior" and the "posterior probability" as the "posterior". The likelihood brings in the effect of the data, while the prior specifies the belief in the hypothesis before the data was observed.
More formally, Bayesian inference uses Bayes' formula for conditional probability:
-
-
-
In statistics, a confounding variable (also confounding factor, lurking variable, a confound, or confounder) is an extraneous variable in a statistical model that correlates (positively or negatively) with both the dependent variable and the independent variable.
-
For example, assume that a child's weight and a country's gross domestic product (GDP) rise with time. A person carrying out an experiment could measure weight and GDP, and conclude that a higher GDP causes children to gain weight, or that children's weight gain boosts the GDP. However, the confounding variable, time, was not accounted for, and is the real cause of both rises.
A further example is the statistical relationship between ice cream sales and drowning deaths. When these variables are entered into a statistical analysis, they will show a positive and potentially statistically significant correlation. However, it would be a mistake to infer a causal relationship (i.e., ice cream causes drowning) , because of the presence of an important confounding variable which causes both ice cream sales and an increase in drowning deaths: summertime.
-
-
-
In statistics, correlation and dependence are any of a broad class of statistical relationships between two or more random variables or observed data values.
-
Formally, dependence refers to any situation in which random variables do not satisfy a mathematical condition of probabilistic independence. In general statistical usage, correlation or co-relation can refer to any departure of two or more random variables from independence, but most commonly refers to a more specialized type of relationship between mean values. There are several correlation coefficients, often denoted ρ or r, measuring the degree of correlation.
-
-
-
"Correlation does not imply causation" is a phrase used in science and statistics to emphasize that correlation between two variables does not automatically imply that one causes the other (though it does not remove the fact that correlation can still be a hint, whether powerful or otherwise).[
-
Empirically observed covariation is a necessary but not sufficient condition for causality.
-
-
-
Frequency probability is the interpretation of probability that defines an event's probability as the limit of its relative frequency in a large number of trials. The development of the frequentist account was motivated by the problems and paradoxes of the previously dominant viewpoint, the classical interpretation.
-
-
-
In statistics, the Pearson product-moment correlation coefficient (sometimes referred to as the PMCC, and typically denoted by r) is a measure of the correlation (linear dependence) between two variables X and Y, giving a value between +1 and −1 inclusive. It is widely used in the sciences as a measure of the strength of linear dependence between two variables.
-
-
-
In statistical hypothesis testing, the p-value is the probability of obtaining a test statistic at least as extreme as the one that was actually observed, assuming that the null hypothesis is true.
The lower the p-value, the less likely the result is if the null hypothesis is true, and consequently the more "significant" the result is, in the sense of statistical significance. One often rejects a null hypothesis if the p-value is less than 0.05 or 0.01, corresponding to a 5% or 1% chance respectively of an outcome at least that extreme, given the null hypothesis. Stating that the p-value is the observed significance level of a hypothesis test implies that the p-value is also the probability of making a Type I error because the significance level equals the probability of making a Type I error.
-
For example, an experiment is performed to determine whether a coin flip is fair (50% chance of landing heads or tails) or unfairly biased (> 50% chance of landing heads or tails).
Suppose that the experimental results show the coin turning up heads 14 times out of 20 total flips. The p-value of this result would be the chance of a fair coin landing on heads at least 14 times out of 20 flips. The probability that 20 flips of a fair coin would result in 14 or more heads is 0.058, which is also called the p-value.
Because there is no way to know what percentage of coins in the world are unfair, the p-value does not tell us whether the coin is unfair. It measures the chance that a fair coin gives such result.
-
-
-
In statistics, a result is called statistically significant if it is unlikely to have occurred by chance.
-
The amount of evidence required to accept that an event is unlikely to have arisen by chance is known as the significance level or critical p-value: in traditional Fisherian statistical hypothesis testing, the p-value is the probability conditional on the null hypothesis of the observed data or more extreme data. If the obtained p-value is small then it can be said either the null hypothesis is false or an unusual event has occurred. It is worth stressing that p-values do not have any repeat sampling interpretation.
-
-
Laws and Theorems
-
-
The infinite monkey theorem states that a monkey hitting keys at random on a typewriter keyboard for an infinite amount of time will almost surely type a given text, such as the complete works of William Shakespeare.
-
The probability of a monkey exactly typing a complete work such as Shakespeare's Hamlet is so tiny that the chance of it occurring during a period of time of the order of the age of the universe is minuscule, but not zero.
-
-
-
In probability theory, the law of large numbers (LLN) is a theorem that describes the result of performing the same experiment a large number of times. According to the law, the average of the results obtained from a large number of trials should be close to the expected value, and will tend to become closer as more trials are performed.
-
Similarly, when a fair coin is flipped once, the expected value of the number of heads is equal to one half. Therefore, according to the law of large numbers, the proportion of heads in a large number of coin flips should be roughly one half. In particular, the proportion of heads after n flips will almost surely converge to one half as n approaches infinity.
-
-
Fallacies
-
-
The gambler's fallacy, also known as the Monte Carlo fallacy (due to its significance in a Monte Carlo casino in 1913)[1] or the fallacy of the maturity of chances, is the belief that if deviations from expected behaviour are observed in repeated independent trials of some random process then these deviations are likely to be evened out by opposite deviations in the future. For example, if a fair coin is tossed repeatedly and tails comes up a larger number of times than is expected, a gambler may incorrectly believe that this means that heads is more likely in future tosses.[2] Such an expectation could be mistakenly referred to as being due. This is an informal fallacy. It is also known colloquially as the law of averages.
-
The reversal is also a fallacy, the reverse gambler's fallacy, in which a gambler may instead decide that tails are more likely out of some mystical preconception that fate has thus far allowed for consistent results of the tail; the false conclusion being, why change if odds favor tails? Again, the fallacy is the belief that the "universe" somehow carries a memory of past results which tend to favor or disfavor future outcomes.
-
-
-
One form of the fallacy results from misunderstanding conditional probability, or neglecting the prior odds of a defendant being guilty; i.e., the chance an individual might be guilty even though there's no evidence directly implicating him/her. When a prosecutor has collected some evidence (for instance a DNA match) and has an expert testify that the probability of finding this evidence if the accused were innocent is tiny, the fallacy occurs if it is concluded that the probability of the accused being innocent must be comparably tiny. The probability of innocence would only be the same small value if the prior odds of guilt were exactly 1:1. In reality the probability of guilt would depend on other circumstances. If the person is already suspected for other reasons, then the probability of guilt would be very high, whereas if he is otherwise totally unconnected to the case, then we should consider a much lower prior probability of guilt, such as the overall rate of offenders in the populace for the crime in question, and the probability of guilt would be much lower.
-
Another form of the fallacy results from misunderstanding the idea of multiple testing, such as when evidence is compared against a large database. The size of the database elevates the likelihood of finding a match by pure chance alone; i.e., DNA evidence is soundest when a match is found after a single directed comparison because the existence of matches against a large database where the test sample is of poor quality (common for recovered evidence) is very likely by mere chance.
-
-
-
The representativeness heuristic is a rule of thumb wherein people judge the probability or frequency of a hypothesis by considering how much the hypothesis resembles available data as opposed to using a Bayesian calculation. While often very useful in everyday life, it can also result in neglect of relevant base rates and other cognitive biases. The representative heuristic was first proposed by Amos Tversky and Daniel Kahneman[1]. In causal reasoning, the representativeness heuristic leads to a bias toward the belief that causes and effects will resemble one another (examples include both the belief that "emotionally relevant events ought to have emotionally relevant causes", and magical associative thinking)[2].
-
-
Puzzling
-
-
- die A has sides {2,2,4,4,9,9},
- die B has sides {1,1,6,6,8,8}, and
- die C has sides {3,3,5,5,7,7}.
- the probability that A rolls a higher number than B is 5/9 (55.55 %),
- the probability that B rolls a higher number than C is 5/9, and
- the probability that C rolls a higher number than A is 5/9.
Consider a set of three dice, A, B and C such that
Then:
-
A set of nontransitive dice is a set of dice for which the relation "is more likely to roll a higher number" is not transitive.
-
-
-
In probability and statistics, Simpson's paradox (or the Yule-Simpson effect) is an apparent paradox in which the successes in different groups seem to be reversed when the groups are combined.
-
Suppose two people, Lisa and Bart, each edit Wikipedia articles for two weeks. In the first week, Lisa improves 60 percent of the 100 articles she edited, and Bart improves 90 percent of 10 articles he edited. In the second week, Lisa improves just 10 percent of 10 articles she edited, while Bart improves 30 percent of 100 articles he edited.
-
1 - 20 of 20
20 items/page
List Comments
(0)
List Info

20 items | 23 visits