
This link has been bookmarked by 1 people . It was first bookmarked on 07 Oct 2008, by Michael.
-
07 Oct 08
-
Back in June I did a study on the relationship between the S&P to its 20-, 50-, and 200-day MAs.
-
The take home lesson is for the next month or two further downside is not just likely but probable
-
As of Friday's close the S&P was 9% off its 20-day MA, 13% from its 50-day MA, and 21% from its 200-day MA. Have there been situations in the past which closely mirrored this - and if so, what happened next?
There were five periods since 1951 which matched this set-up in the S&P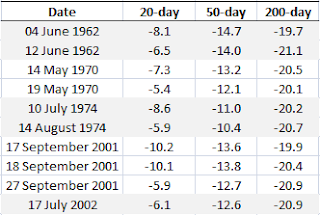
How did markets perform after these periods? -
The greatest number of matches came in 2001. This time the relationship between the moving averages and the S&P came within a week of the lows, although the attempted retest failed and new lows were posted in 2002. It was in 2002 that another matched relationship was made between the MAs and a positive retest was posted 3 months later. This eventually led to the cyclical bull market completed in 2007:
-
- What do these historical comparisons tell us?
- We are likely a couple of weeks from a bottom, but it is not impossible for this to take longer
- During this period the market will see sharp losses, perhaps trimming 10-20% off where the markets lie now (Monday will be the start)
- The subsequent rally will be short lived and will morph into a retest of the low
- The retest will be the time to buy heavy
- A significant bull market has a good chance of emerging from the quagmire - remember markets lead economic news.
- We are likely a couple of weeks from a bottom, but it is not impossible for this to take longer
-


Would you like to comment?
Join Diigo for a free account, or sign in if you are already a member.